「输出」开销:为什么我们向 stdout 输出时那么慢?
本文发布于 Medium: Console output overhead: why is writing to stdout so slow?
Generally, when we code through our projects, we need to output certain values in order to understand what the program is currently doing and what results it shows. Normally we do this with a simple print function:
print('Hey look, this is the result.')And for most of our use cases, this would be more than enough. However, when we are outputting a huge amount of data, like printing a file with 10k lines of text onto the terminal, we will eventually suffer from IO bottlenecks. This is something I discovered when trying to find a nice progress bar library for PyTorch in order to monitor the model’s training progress. Let me explain.
What did I discover?
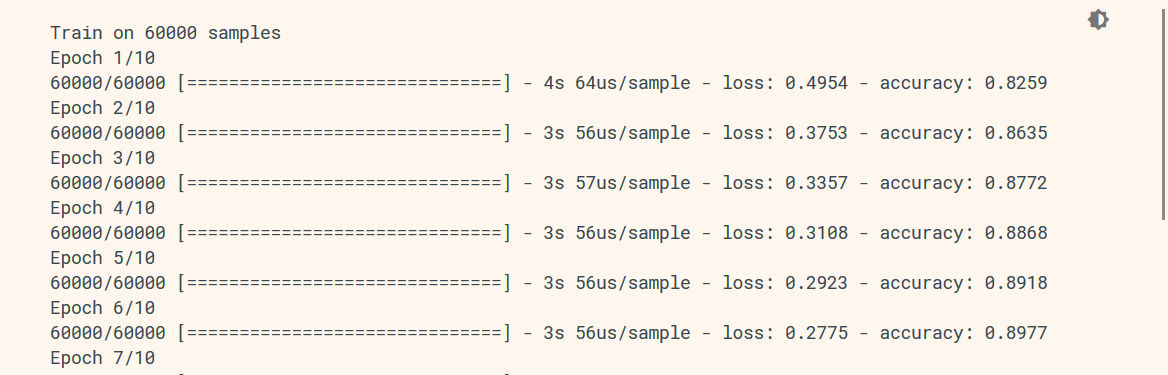
Now, if you are familiar with modern neural network libraries, you may have heard of Keras. Keras is a highly encapsulated library that takes care of data output, model compilation, backward propaganda and more for you under the hood, meaning that it offers less agility than other low-level libraries like PyTorch. The one feature I really appreciate about Keras is its nice little training progress bar that shows the current training progress, iteration duration, ETA, loss and other relevant statistics. Below is an example.
However, PyTorch offers far more customizable features when it comes to designing, compiling and training your model, but it also means you have to take care of outputting progress, training details and others by yourself. This is when I discovered IO bottlenecks when outputting directly to stdout, that is, your terminal.
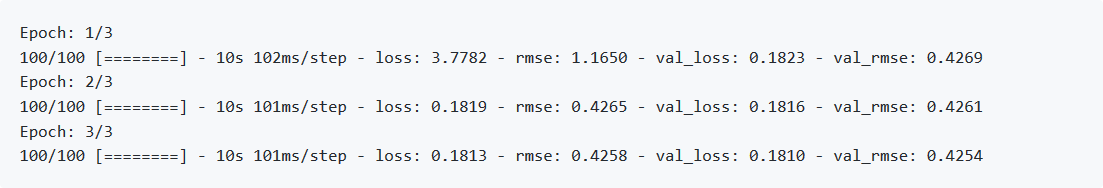
The library I first tried is called pkbar — a progress bar library intended to bring Keras style progress monitoring to the PyTorch ecosystem. (Don’t use it!) It’s outputs are like this:
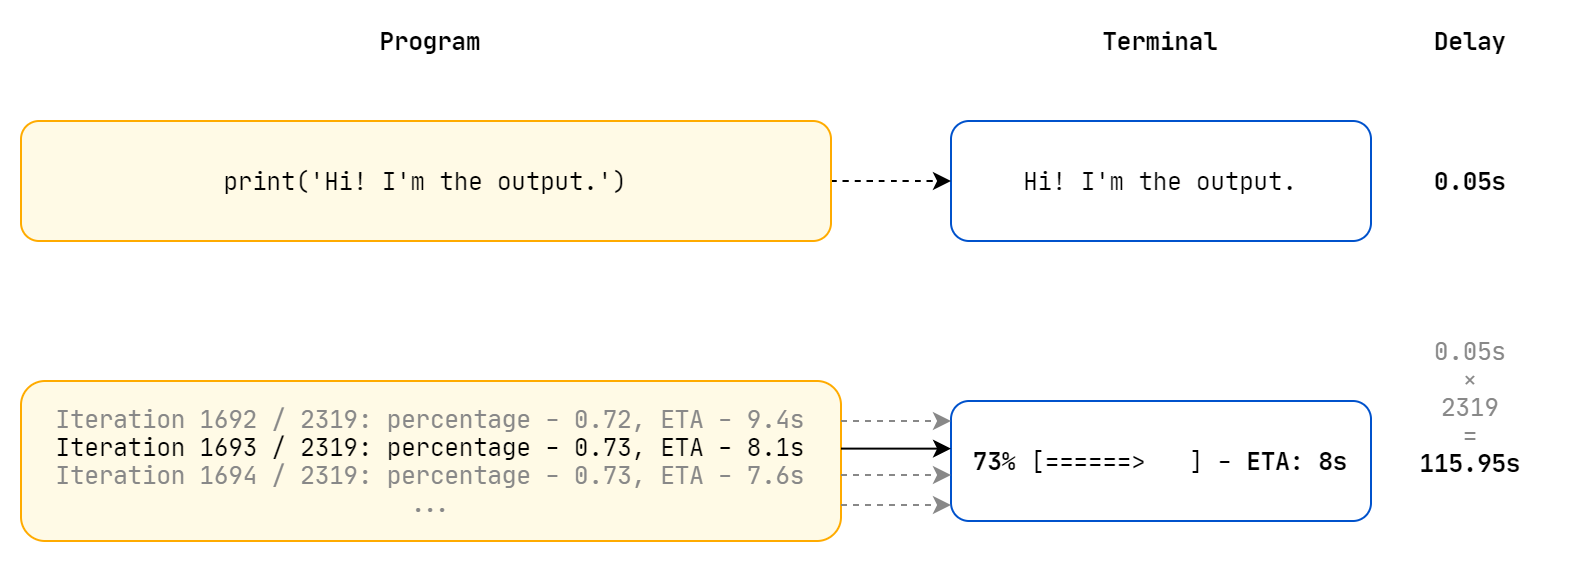
Most progress bar libraries are implemented by wrapping itself around an iterative object, in our case, a PyTorch Data Loader. When building a progress bar, we need to refresh our progress, statistics and other parameters on each iteration. This means every time we come to the end of an iteration, we need to output to our terminal with a delay when the program waits for the writing to return. This delay is often unnoticed when we are simply writing a single message, but when we are iterating through thousands of images, we need to write the latest status on each iteration. A small delay multiplied by a thousand iterations gives us a huge time difference, and results in bottlenecks we encounter now.
What happened to me when I was using pkbar was exactly what I described above: each iteration was accompanied with a delay which eventually builds up into a time difference I simply can’t ignore. To put numbers into perspective, I was applying a DeepFool adversarial attack on a pre-trained ResNet18 CNN. It took about 5 minutes on my laptop running on GPU without pkbar, and when I added pkbar to visualize progress, it gave me an ETA of nearly 20 minutes! Holy crap, I removed pkbar almost immediately.
So why were there delays?
In order to find out what was causing this huge delay and how we could avoid it, I turned for help on Stack Overflow. A particular question gave me the answer: Why is printing to stdout so slow? Can it be sped up?
In this question, the author compared the following speeds:
- Writing output to the terminal, which is
stdout - Writing output to a file
- Writing output to
stdout, but withstdoutredirected to/dev/null
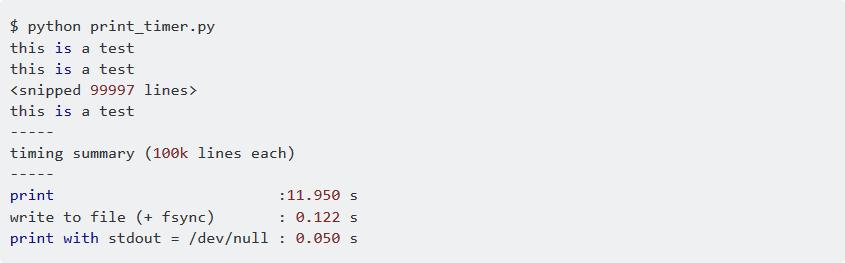
Wow, that shows a huge difference for printing to stdout and redirecting stdout to /dev/null. Even writing output to file is faster than directly writing to the terminal. So…, why?
Congratulations, you have just discovered the importance of I/O buffering. :-)
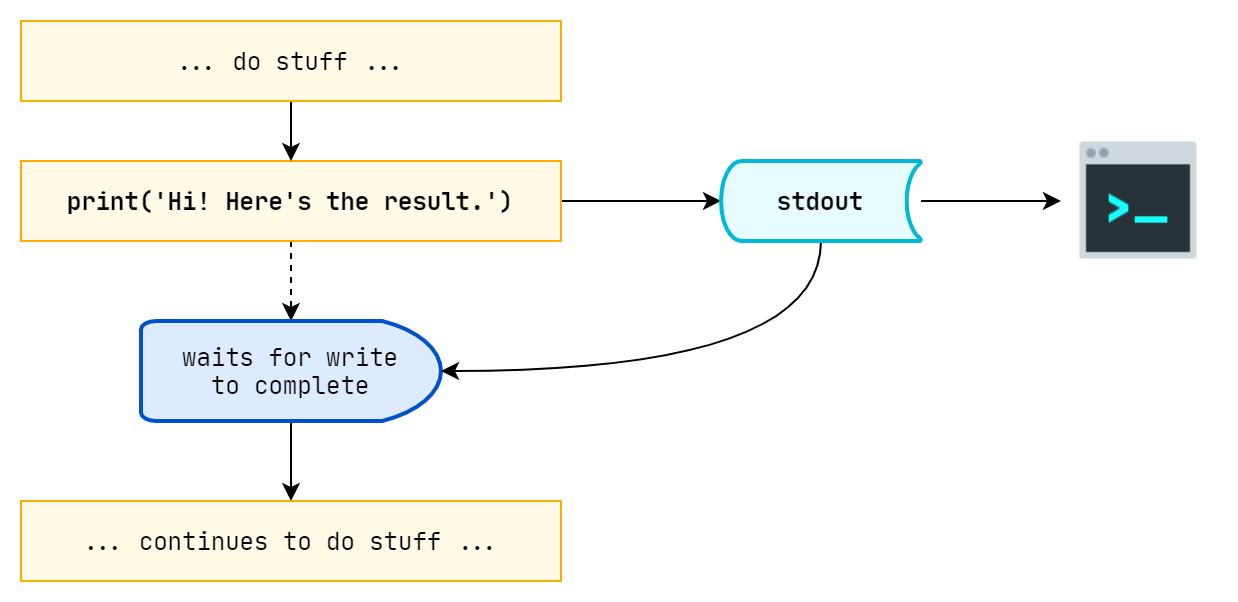
So it turns out that I/O buffering is what made even “writing to file” faster than “writing to stdout”. When we are directly writing outputs to our terminal, each writing operation is being done “synchronously”, which means our programs waits for the “write” to complete before it continues to the next commands.
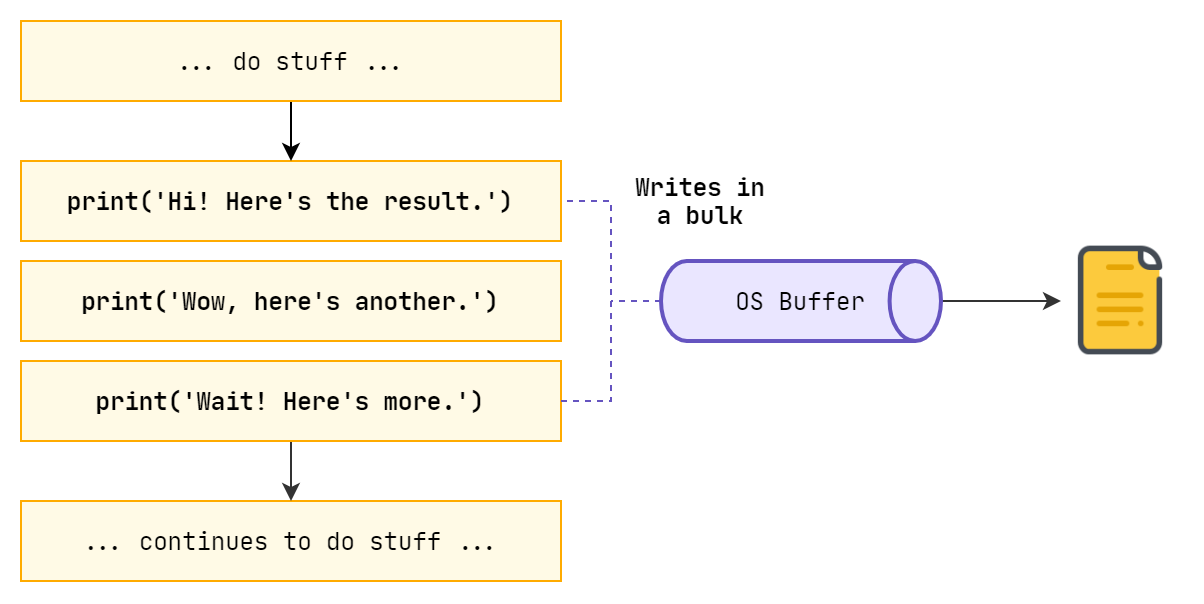
Each time our programs writes something to stdout, we are met with this delay. However, writing to files are not of the same case. When we are writing to files, we have what is known as “I/O buffering”, which means the program outputs whatever it needs to write to the file, and the OS catches all these contents to write where it then stores in a file as a bulk afterwards. All our “write” functions return before anything is actually written to a file.
So what should we do here? Well, in order to avoid I/O overhead, we either have to do training and update output in parallel or asynchronously like we do in GUIs when we have an UI thread and a controller, or we will need to write in bulks to stdout like what we are doing when writing to files. It’s a trade-off: interactivity versus bulk efficiency.
What I did to visualize PyTorch training with minimum overhead?
After I ditched pkbar, I found a perfect progress bar library: tqdm — A Fast, Extensible Progress Bar for Python and CLI. With over 13.4k+ stars, tqdm is easily the best Python library for us to implement training progress visualization.
tqdm is simple, efficient and comes with minimal overhead. The author claims that tqdm only delays output for a minimum of 60ns per iteration. That’s impressive. In addition to its low overhead, tqdm uses smart algorithms to predict the remaining time and to skip unnecessary iteration displays, which allows for a negligible overhead in most cases.
Installation
Either install tqdm using conda directly:
conda install -c conda-forge tqdmAnd install ipywidgets with pip to enable Jupyter Notebook integration:
pip install ipywidgetsOr integrate the following code to your environment.yml:
channels:
  - conda-forge
  - defaults
dependencies:
  - tqdm
  - pip:
      - ipywidgets
Then run:
conda env updateIntegration
We can easily integrate tqdm into our PyTorch project. Basically what you need to do is just to wrap tqdm on an iterable object, and that’s it.
from tqdm import tqdm
for i in tqdm(range(10000)):
    ...
76%|████████████████████████████ | 7568/10000 [00:33<00:10, 229.00it/s]For PyTorch DataLoader, we can first load our data like so:
dataset_loader = torch.utils.data.DataLoader(dataset, batch_size=4)Then initialize tdqm:
pbar = tqdm(dataset_loader)Here, we can add the description of the progress bar:
pbar.set_description('Validate predictions')Also, we can initialize the post-fix dict for the progress bar, so that we can update the post-fix on the fly:
pbar.set_postfix(loss='0.0%', acc='0.0%')And Voilà! We can directly iterate through tdqm, just like we did with PyTorch DataLoader. (My model is wrapped with Foolbox, so I can make predictions with the .forward() function.)
for image, label in pbar:
  # make a prediction
  prob = model.forward(image.numpy())

  ...  # calculate and update loss
  pbar.set_postfix(loss='{:.2f}%'.format(loss))

  # calculate and update accuracy
  pbar.set_postfix(acc='{:.2f}%'.format(acc))
Features
tqdm can be used directly in a CLI environment with no special configuration whatsoever.
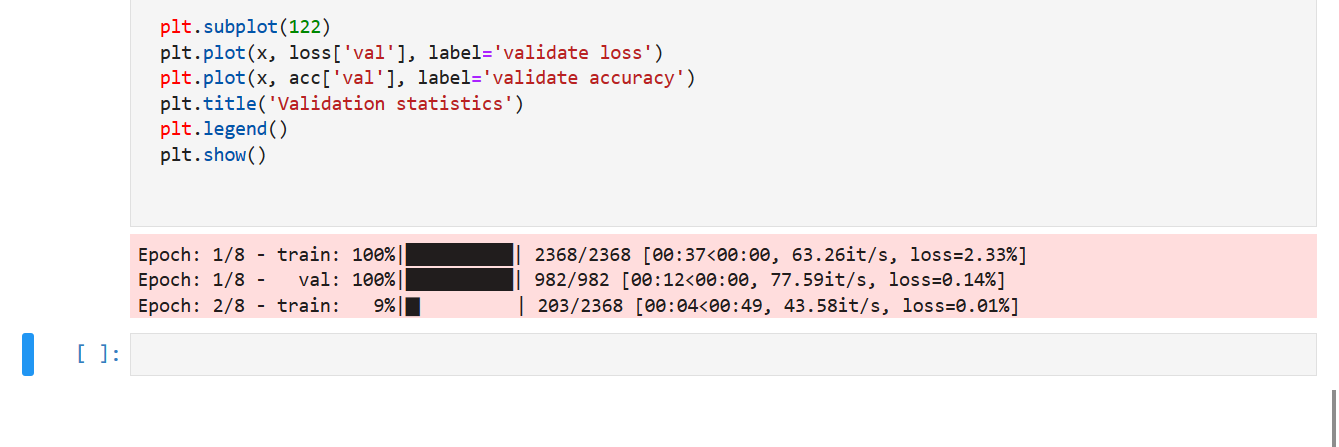
Also, we can run tqdm in VS Code’s Python Interactive console, or Jupyter Notebook. In this case, tqdm will output progress asynchronously according to the Notebook API.
To kick it up a notch, we can actually output “real” progress bars. Utilizing ipywidget, we can directly draw interactive progress bars inside Jupyter Notebook. See here for instructions on how to enable ipywidgets.
After enabling these widgets inside Jupyter Notebook, all we have to do is change the way on how we imported tqdm. Change:
import tqdm as tqdmTo:
import tqdm.notebook as tqdmNow, run the code once more, if everything goes well, we should be able to see a neat progress bar with colors indicating the current task’s state: pending, success or failure.
This is the end of the article, for more information on how to utilize tqdm, I recommend this article: Python Progress Bars with tqdm by Example. Also, the official documentation of tqdm is quite thorough, covering most cases when using tqdm.
There’s one thing to note, and that is: you should not use “print” to output anything when a tqdm progress bar is running, as this behavior will mess up the tqdm output. If you have to write something, do remember to use:
tqdm.write(<context>)That’s all, thanks for reading.